When you podcast, you naturally want to know whether and how often you are being listened to.
Now there is the option of using Wordpress or similar CMS which, in conjunction with Podlove plugins, provide you with everything you need.
Well - anyone who knows Nerdbude will know that this is out of the question.
(Podlove is of course still worth supporting - no question about it)
I have started a PODCAST REPO on Github.
There you will find everything you need for DIY podcasting.
Among other things, there is also a way to get statistics.
Overview
To get statistics (downloads, players, etc.) from your podcast, Wordpress and Co. use databases.You can do that. But you don't have to. I actually want to keep everything as small as possible here, so no Wordpress and no DB.
So what is available to get statistics?
If the web space provider already writes logs, then we use them too.
(First of all: the IP addresses are anonymized.)
In addition, separate software in the form of GoAccess is needed for visualization.
Log files
The provider must, thanks to the law, write access logs.These logs naturally also contain the accesses to the individual podcast episodes.
You just have to filter them.
This is what an entry in the access log that you want to have looks like:
anon - - [04/Mar/2021:23:23:00 +0100] "GET /podcast/audio/CCH_001.mp3 HTTP/2.0" 200 11376985 "-" "Pocket Casts"
The structure:
[IP] - - [DATE:TIME] [FILE] [HTTP CODE] [FILESIZE] [CLIENT]
The structure will be important for analysis later.
But there are also other things in the log file Accesses that are not relevant to the podcast.
For this purpose, I have a small shell script in the repository that splits up the log file.
First, only the entries that refer to the directory with the episodes are filtered out:
BASH
grep "/podcast/audio" $newlog > filtered.log
Here, all entries that contain "/podcast/audio" are written from the log file into a temporary filtered.log using grep.
This gives us all the entries that refer to the episodes and throws away the rest.
Then we filter by episode, i.e. all entries for each individual episode.
BASH
grep "GET /podcast/audio/CCH_000.mp3" filtered.log > f000.log
Here grep gets the lines from the filtered.log that contains the episode and writes them to a new temporary log file that is episode-specific (f000.log).
This is now done for each episode, so that you get a log catalog with all episodes (f000.log, f001.log, etc.).
Now we continue with the downloads.
BASH
grep "200 234223" f000.log > fs000.log
Here grep grabs all lines with the HTTP code 200 (for download) and the complete file size in bytes (233223) from the file "f000.log" and writes them in the temporary "fs000.log"
This means we only get the entries for completed downloads.
The content of the temporary "fs000.log" is now appended to the episode0.log:
BASH
cat fs000.log episode0.log > episode0.log
Cat reads the contents of "fs000.log" and "episodeo.log" and writes both contents to "episode0.log". This gives you all the log entries since the beginning.
Finally, we combine all available episode logs into a master:
BASH
    cat fs000.log fs001.log fs002.log > fsmaster.log
    cat master.log fsmaster.log > final_master.log
Here again, all temporary episode logs (fs000.log, fs001.log etc.) are written to a temporary master log file (fsmaster.log)
and then written to the final_master.log, so that you have a log file that contains all episode downloads.
The temporary log files are then deleted because we no longer need them.
If all this is too much effort for you, use the "sortlog.sh" in the repository.
The log files are ready at this point.
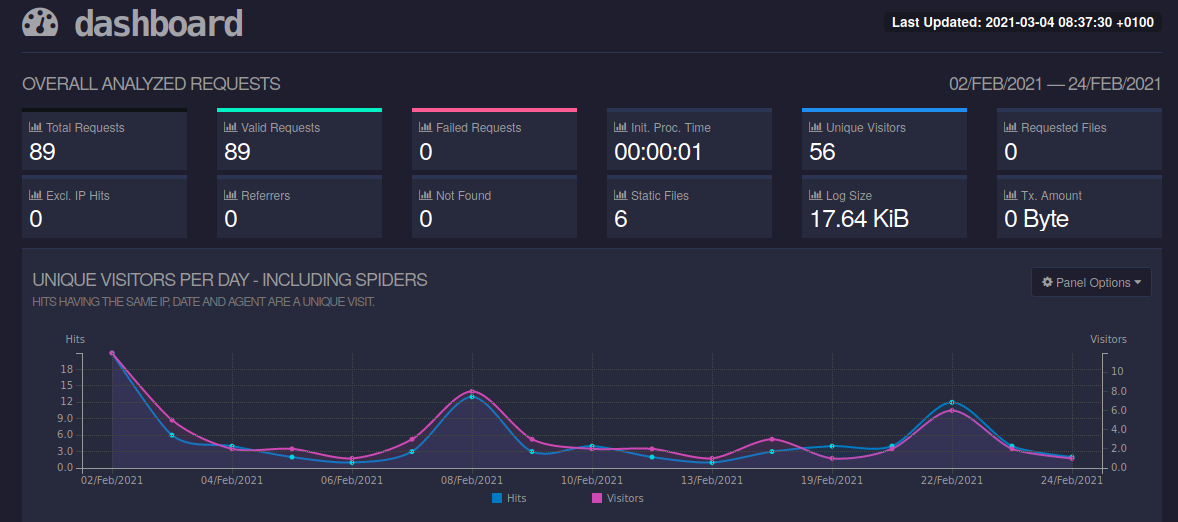
Dashboard
Now statistics look better when you have them in a nice dashboard.There are ways to display the whole thing with Grafana and similar tools, but there is also a DB attached and that is like using a sledgehammer to crack a nut for my little podcast.
That's why we use a tool called "GoAccess" - a small, fine log file viewer that runs primarily in the terminal but also offers the option of an HTML dashboard.
In order for GoAccess to be able to handle the log files, parameters must be specified. In my case (see example above) it looks like this:
BASH
goaccess master.log --log-format='%h %^[%d:%t %^] "%r" %s %D "%u"' --date-format=%d/%b/%Y --time-format=%T --no-ip-validation
This starts GoAccess in the terminal with the master.log.
The HTML dashboard can be started with the following parameters:
BASH
goaccess master.log --log-format='%h %^[%d:%t %^] "%r" %s %D "%u"' --date-format=%d/%b/%Y --time-format=%T --no-ip-validation -o /home/ph_0x17/dashboard.html --real-time-html
Now you can see in the terminal that a small dashboard server is being started.
The dashboard can be accessed via browser at: /home/ph_0x17/dashboard.html.
Taaaaa! Statistics!
Have fun with it.
[~] BACK